At its meetings, the Investment Committee decided on the following changes to the asset allocation for medium-risk balanced Swiss Franc portfolios, not subject to client’s restrictions (mandates in different reference currencies at times display different nominal weightings and weighting changes).
Money Market
The money market quota remains at an over-weighted level. In uncertain times, it serves as a buffer against price fluctuations in the other asset classes, as well as a reserve in order to be able to act quickly when opportunities suddenly arise.
Bonds
We did not make any active changes to the bond portfolio in the third quarter. Of course, there were repayments as a result of maturities and, where possible, reinvestments made in new securities. Overall, we are still underweight in bonds.
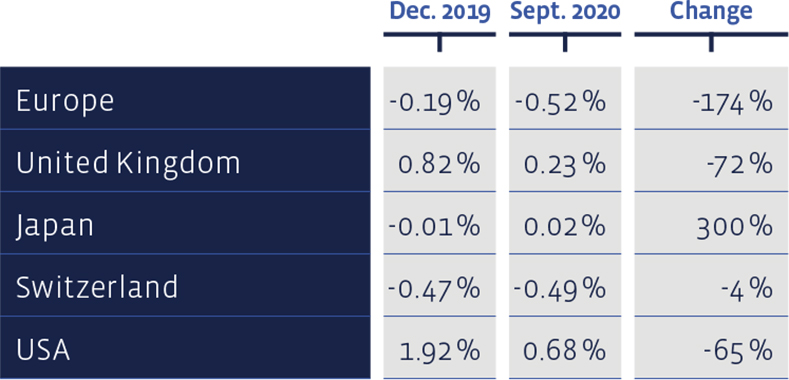
During the course of the year, yields on 10-year government bonds declined almost everywhere:
Equities Switzerland
Swiss equities continued to gain slightly in the third quarter and, as measured by the Swiss Performance Index (SPI), now stand just under one percent in the red since the beginning of the year. The direct investment portfolio “Swiss Stock Portfolio” (SSP) was able to outperform the benchmark in all of the past three months and thus further reduce the underperformance compared to the index. Siegfried (+ 47.6% in the third quarter), Sonova (+ 23.5%) and Cembra Money Bank (+ 18.2%) were the most noticeable stocks in this stock selection, which was compiled according to value criteria.
For the first nine months of the year, the SSP selection showed a performance of -3.08% that of the SPI was -0.88%. For the SSP-based certificate, "Strategy Certificate linked to the SIM - Swiss Stock Portfolio Basket" (Valor: 36524524, ISIN: CH0365245247), the performance in the same period was -4.9%.
In the long term, the performance of our value-criteria driven selection is quite presentable. Since 2012, the average annual performance of the SSP amounts to 13.9%, a result that beats the average benchmark’s performance of 10.5% markedly. Since 2012, the total cumulative return of this strategy amounts to about 211%, while that of the index is 138%. The SSP figures bear transaction costs, whereas the benchmark index does not bear any costs.
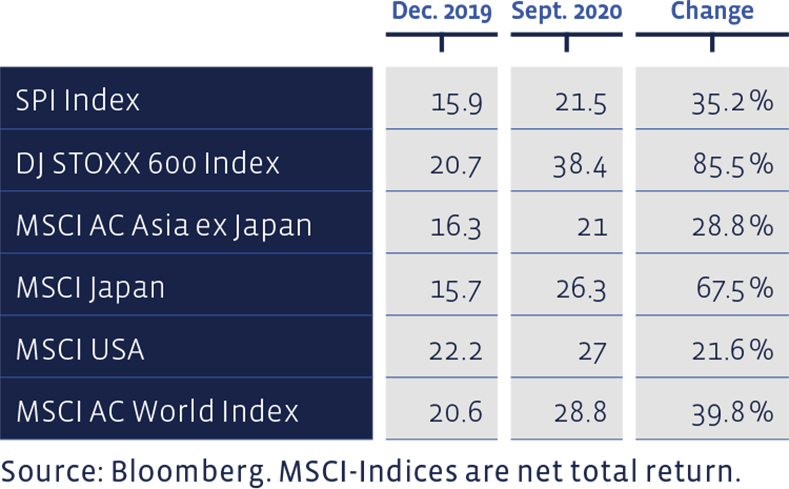
Measured on the Price/Earnings ratio using the latest 12 months profit figures, all equity markets have become more expensive since the beginning of the year:
Equities Europe
The European direct investment portfolio, “European Stock Portfolio” (ESP), which is also focused on the value style, is -12.2% in the year to date and was thus able to recover slightly in the third quarter. The broad Dow Jones Stoxx 600 Index brings it to -11.6% (price changes plus distributions) in the same period. The Dow Jones Stoxx 600 Value Index, which focuses on the value style, shows a minus of 23.5% at the end of September.
In the long term, the ESP displays a marked outperformance against the broad index. Since 1993, the ESP has returned on average 7.8%, compared to the 6.5% achieved by the benchmark. The transaction costs, as well as taxes withheld, are deducted in ESP figures, whereas the index is calculated without bearing any costs. The cumulative performance of the ESP since 1993 amounts to about 772%, while that of the benchmark to about 504%.
Equities USA
The weighting of American equities did not change in the third quarter and thus remained neutral. The rise, which was mainly carried by technology stocks, continued more or less unchecked and made the index of US stocks (MSCI + 9.5%) one of the best in the last three months.
The Performa Fund US Equities we use performed even better and cracked the 10% mark for the past quarter. In the year to date, this fund has clearly outperformed the benchmark index with an increase of 24.3%. The BB Adamant Medtech und Services Fund has also moved up, whereas the MSCI World Energy ETF purchased in May, has not yet met expectations.
Equities Asia (ex Japan)
In the emerging countries, especially in Asia, the stock market development was even more dynamic. The MSCI Index Asia ex Japan gained 10.7% in the third quarter and is now trading at + 5.4% so far this year. We estimate that the emerging economies in the Far East will do better than in other regions of the world in the future, and that the Covid-19 pandemic will separate the wheat from the chaff even more. For this reason, we also reflect this scenario more closely in the investments. We have therefore sold the SwissRock Emerging Markets Equity Fund, which is invested globally.
On the one hand, we used the proceeds to increase our holding in the Aberdeen Asia Pacific Fund. At the same time, we have switched to the institutional tranche of this fund wherever this had not yet been the case. The reason being that this tranche bears lower costs for the investor. A new investment was made in the Barings ASEAN Frontiers Fund. This vehicle invests - nomen est omen - in countries that belong to the Southeast Asian confederation ASEAN.
Currently, more than three quarters of the funds invested are in companies in Singapore, Thailand and Indonesia. This is followed by investments in shares in Malaysia, Vietnam and the Philippines. In total, the Association of Southeast Asian Nations comprises ten countries with over 600 million inhabitants and an area of almost 4.5 million square kilometres. In addition to the nations mentioned above, Brunei, Cambodia, Laos and Myanmar are ASEAN members.
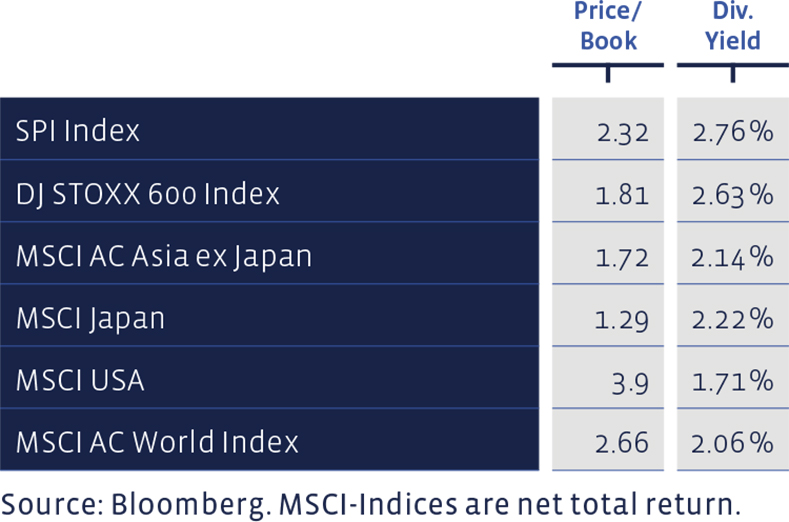
Price/Book and Dividend Yield of major equity markets:
Equities Japan
Stocks in Japan also saw the recovery continue over the most recent three-month period. However, the level of the overall stock market valuation has not yet reached the level of the end of 2019. The positions remained unchanged and thus remained slightly overweighted.
Alternative Investments
The number for the quarterly change in alternative investments also lights up green. Although the alternatives have not yet made much headway, they were punished much less by the crash in March than other forms of investment. We have not made any changes here and have kept our underweight position.
Precious Metals
Gold did not lag behind in this reporting period, on the contrary, it expanded its performance lead over other asset classes and cost around a quarter more at the end of September than at the end of 2019. At the beginning of August, the precious metal climbed to an all-time high at 2,060 US dollars per ounce, before it corrected downwards a little recently. We kept the positions unchanged, which corresponds to an overweight position.
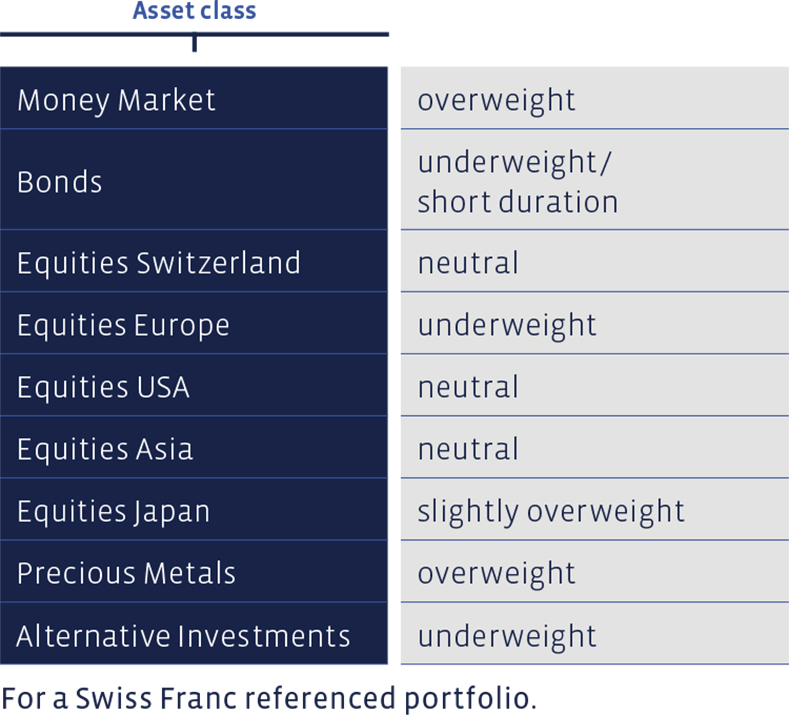
Summary of our current Asset Allocation:
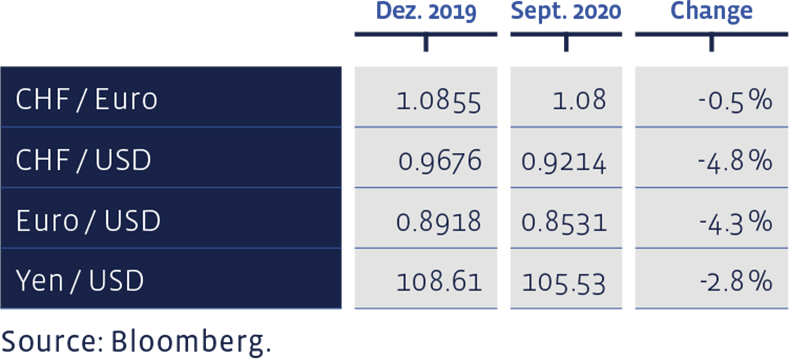
Since the beginning of the year, selected foreign exchange rates have developed as follows: