Asset Allocation
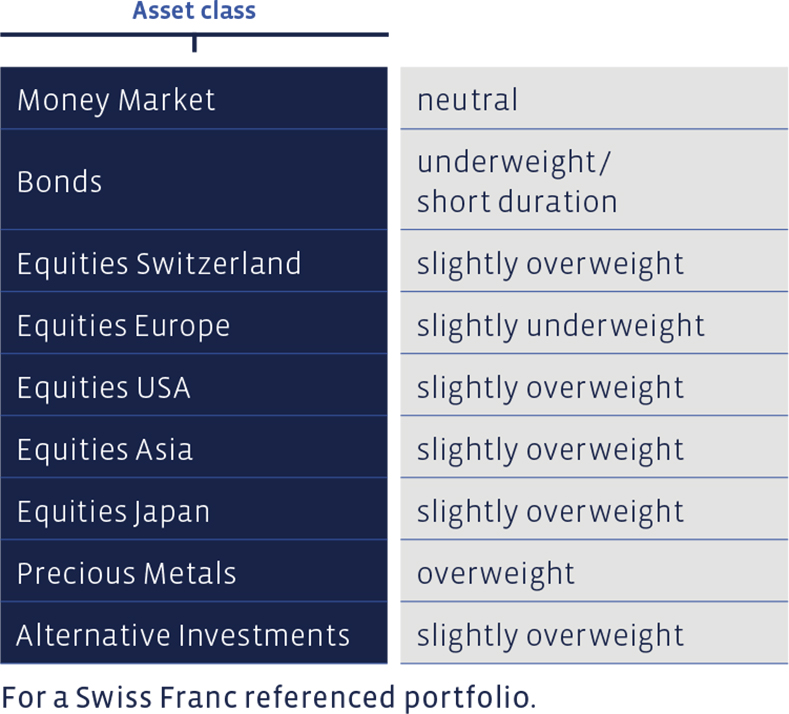
At its meetings, the Investment Committee decided on the following changes to the asset allocation for medium-risk balanced Swiss Franc portfolios, not subject to client’s restrictions. Mandates in different reference currencies at times display different nominal weightings and weighting changes.
Money Market
There have been no significant changes here. The percentage rate lies approximately within the range of a neutral weighting.
Bonds
We have also made no changes to the bond positions, which means that the weighting of fixed-interest securities remains underweighted. The slight upward shift in the yield curve that occurred in the past quarter has been in our favour, as the losses have been limited. However, despite the slightly higher bond yields, an increase in bond maturities is not indicated in any currency. We continue to avoid government bonds. High-yield bonds move in a positive economic environment.
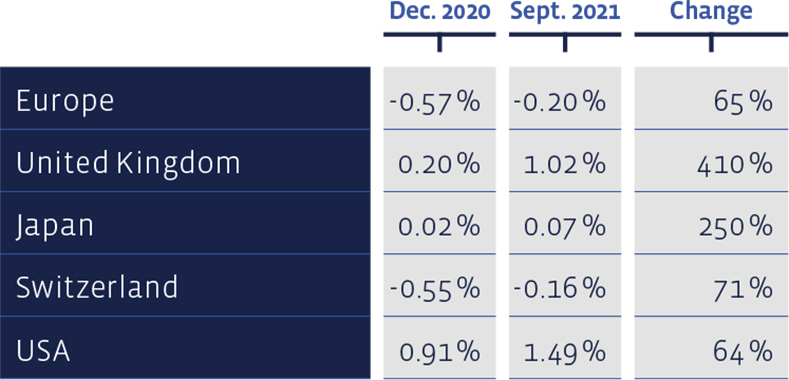
During the course of the year, yields on 10-year government bonds increased everywhere:
Equities Switzerland
The prices of Swiss equities declined slightly in the reporting period. The Swiss Performance Index (SPI) went down by around 2%, slightly more than our "Swiss Stock Portfolio" (SSP), whose performance amounts to -1.55%. The figures are understood as total return, i.e. price changes plus any dividends. For the first nine months of the year, the performance of our value stock selection is +13.26%, beating the SPI by 0.38 percentage points and the large-cap index, the SMI, by 1.38 percentage points.
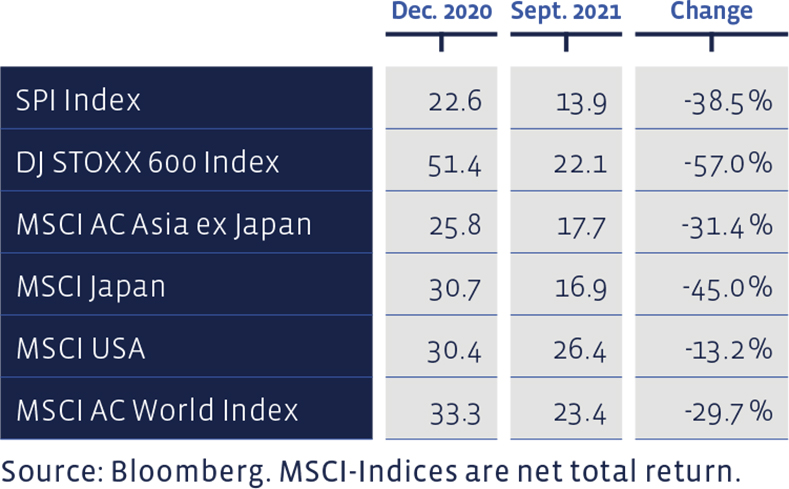
Price/Earnings ratios, using the latest 12 months profit figures, have all declined:
For the "Strategy Certificate linked to the SIM-Swiss Stock Portfolio Basket" certificate based on the SSP (Valor: 36524524, ISIN: CH0365245247), the performance for the first half of the year amounts to a plus of 11.7%.
Seen in the long term, the performance of the "Swiss Stock Portfolio" continues to be excellent. Since 2012, the average annual performance of the SSP has been 14.48%, significantly outperforming the average benchmark performance of 11.25%. Since 2012, the total cumulative return of this strategy amounts to around 274%, while the index that of the index is 182%. The SSP figures bear transaction costs, whereas the benchmark index does not bear any costs.
Equities Europe
Our European stock selection, the “European Stock Portfolio” (ESP), decreased by 1.2% in the third quarter, whereas the broad DJ Stoxx 600 Index was able to post a gain of 0.85%. For the first nine months of the year, the total performance (price changes plus distributions) amounts to +13.16% and thus lags behind the benchmark, which achieved 16.13%. Transaction costs and withholding taxes are deducted from the ESP figures, whereas the benchmark index is calculated without costs.
The long-term picture, however, is much better. The cumulative performance of the ESP since 1993 amounts to around 1067%, while that of the benchmark to around 677% or 8.61% and 7.14% annualised. The comparison with a reference index limited to value stocks is also interesting. In this comparison, for which we have data since 1998, the annual performance of the European Stock Portfolio amounts to 6.69%, compared to 4.39% of the benchmark. In other words, per year, the ESP actually outperformed the value benchmark by 2.3 percentage points, compared to 1.47 percentage points when compared to the overall market.
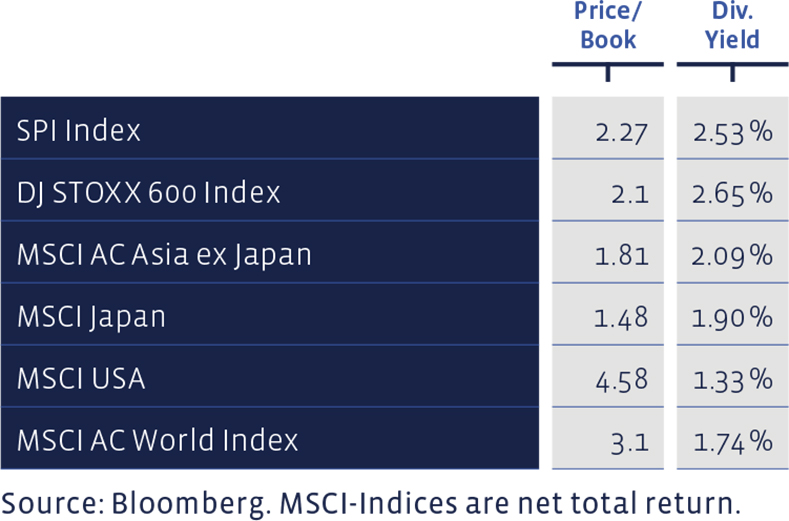
Price / Book and Dividend Yield of major equity markets:
Equities USA
American equities continue to be overweighted. However, this includes the position in the BB Adamant Medtech & Services Fund. This is not a classic investment in a country, but an international sector fund that currently includes mainly American companies. Without this investment vehicle, the US equity position would correspond to a neutral weighting. The double-digit performance of both the Performa and the Medtech & Services Fund was additionally made sweeter for the Swiss Franc and Euro clients by the appreciation of the US dollar.
Equities Asia (ex Japan)
Asian equities (excluding Japan) are also slightly overweighted. The positions remained unchanged in the past quarter. The funds we used were able to cushion the poor performance of the region's index or, in the case of Barings ASEAN Frontier Markets, even more than compensate for it. Converted to the position size in a balanced client portfolio in Swiss Francs or Euros, the exposure to Chinese equities via the Aberdeen Asia Pacific Fund amounts to a manageable 1 to 2%.
Equities Japan
The Japanese market was not affected by the September blues, quite the opposite. The Land of the Rising Sun was one of the few winners in the third quarter. The change of government, but also a certain amount of goodwill shown by investors towards companies that are well positioned for export and have relatively favourable valuations, helped prices to rise. The positions are unchanged and therefore slightly overweighted.
Alternative Investments
Hedge funds, as measured by the Global Hedge Fund Index, were more or less flat in the third quarter. For the year to date, a slight plus remains. Of the instruments we use, the units of the BCV Liquid Alternative Beta Fund have outperformed their benchmark index. There has been no change in the positions compared to the end of June.
Precious Metals
Gold has continued to consolidate. On the one hand, it suffered from the rise in interest rates and, on the other, was unable to benefit from the heightened nervousness on the markets as a safe-haven investment. We have left the positions unchanged.
Summary of our currentAsset Allocation:
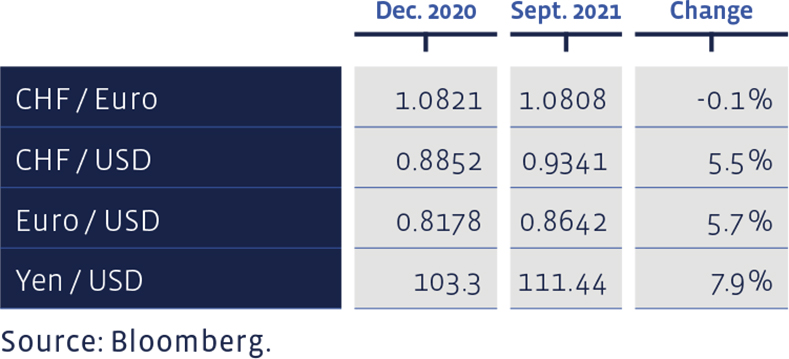
Since the beginning of the year, selected foreign exchange rates have developed as follows:
